104 North Burnett Residents Averaged 51 on a Money Test With No Passing Grade
A small survey of 104 North Burnett residents found steady work, higher income and well-liked support programs went with better financial well-being scores.

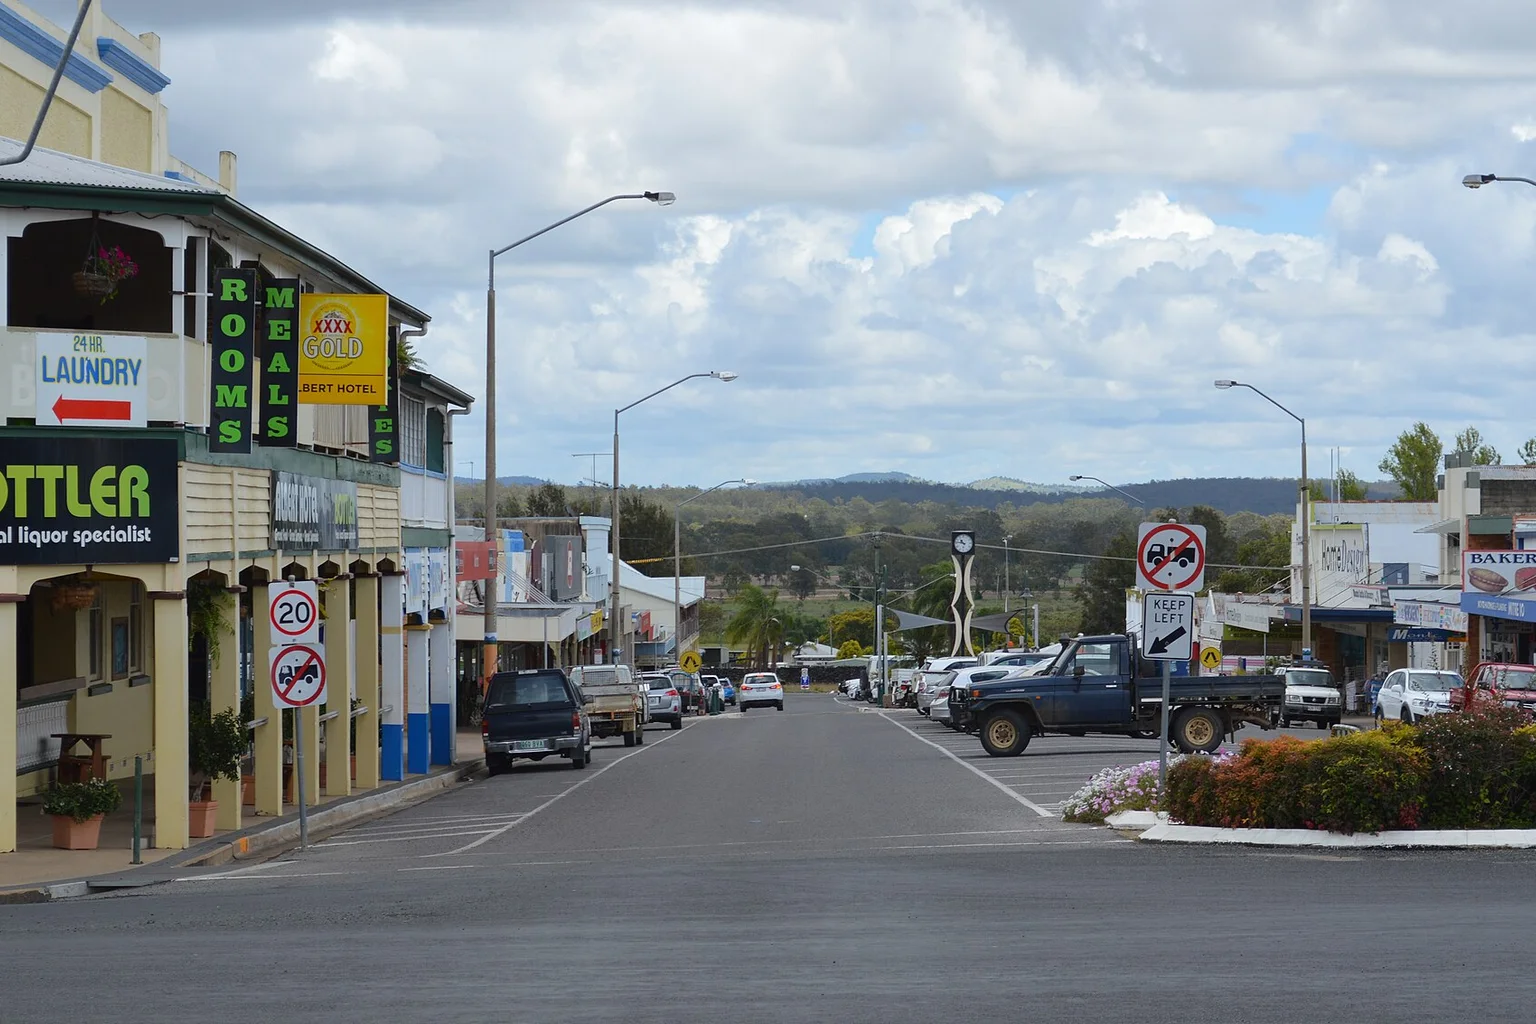
A study published Nov. 4 in the Journal of Risk and Financial Management asked 104 residents of the North Burnett Region in rural Queensland, Australia, to take a free 10-question financial well-being survey. Their average score was 51 out of 100. Higher scores went along with higher income, full-time work and satisfaction with financial support programs.1
The survey itself ran from February to October 2022, so the numbers describe the region a few years before the paper came out. The authors, from Central Queensland University, Griffith University and Canadian Mennonite University’s Menno Simons College, say no earlier study had looked at financial well-being in this region. Most Australian research on the topic has focused on cities.1
That gap matters for the people who live there. North Burnett is classed as outer regional Australia, with 10,068 residents and a median age of 46.1 Policy built from city data does not automatically fit a place like that.
How the 10-question check works
The researchers used a scale created by the U.S. Consumer Financial Protection Bureau (CFPB). It is free, takes 10 questions and produces a score from 0 to 100. The final number is adjusted for the person’s age group and for how the questions were asked.23
The CFPB defines financial well-being as being able to meet current and ongoing bills, feeling secure about the future and having room to make choices that let you enjoy life. People rate statements such as “I have money left over at the end of the month” and “My finances control my life.”34
For comparison, U.S. averages were 54 in a 2017 survey and 55 in 2020. The paper also notes the CFPB’s own guidance that “there is no specific cut-off for ‘good’ or ‘bad’ financial wellbeing score.”1 A 51 is a reading, not a report card.
What went along with higher scores
Income. Respondents earning nothing up to A$599 a week (about US$390) averaged 41. Those earning A$600 to A$999 (about US$390 to US$650) averaged 54, and those earning A$2,500 or more (about US$1,600) averaged 65. Income stayed significantly linked to scores across the researchers’ statistical models.1
Work. Full-time workers averaged 56, while unemployed respondents averaged 32. Full-time work was a significant factor in the simpler models but not in the fullest one, which also accounted for satisfaction with support programs.1
Owning investment property. On simple averages, owners scored 54 and non-owners scored 47.1
Liking the support on offer. People who rated government and non-government financial support programs more highly tended to score higher, and the link was strong in the full model. The authors note it may work the other way around: people who are already doing better may simply be more likely to feel satisfied.1
The asking-for-help gap that faded
On raw averages, people comfortable asking for financial help scored 55, and those uncomfortable asking scored 45. People who had never needed help scored highest, at 58, which is less a strategy than a circumstance. Once other factors were accounted for, the asking-for-help differences were no longer statistically significant.1
Age was messy too. The oldest group, ages 68 to 79, scored highest at 57, but it had only six people, and 18- to 29-year-olds scored 55, above most middle-aged groups. The authors say the age pattern may be specific to this sample.1
Who scored lowest, and what the authors suggest
The six Aboriginal respondents averaged 35, compared with 52 for everyone else. The authors report lower well-being among Indigenous families and write that financial counseling for Indigenous people would not succeed without an understanding of Indigenous culture.1
Their policy suggestions, which the study recommends rather than tests, include free financial counseling and advice for vulnerable or low-income households, better access to financial services in rural areas and attention to housing affordability. They cite figures showing that only about 10% of 9,700 Australian households surveyed in December 2020 had worked with a financial adviser.1
The limits
The sample was small and lopsided: 79% of respondents were women, and 65% lived in the town of Monto. Surveys were shared through town social media groups and in shops via QR code, so the people who answered chose themselves. The researchers say their findings represent the respondents rather than the whole population.1
A statistical check on how consistently the 10 questions measured the same thing in this group also came out low. And the authors are direct about cause and effect, writing that “it is not clear in terms of what causes high or low financial wellbeing levels.”1

Did this make your day? Give it a cheer.
Sources
- Financial Wellbeing and the Influencing Socioeconomic Factors: Evidence from Australian Regional Households Journal of Risk and Financial Management (MDPI), 2026-11-04
- Measuring financial well-being: A guide to using the CFPB Financial Well-Being Scale Consumer Financial Protection Bureau, 2015-12-01
- Quick Guide to the CFPB Financial Well-Being Scale Consumer Financial Protection Bureau, 2017-01-01
- Scoring worksheet (CFPB Financial Well-Being Scale) Consumer Financial Protection Bureau, hosted by the Federal Reserve Bank of Boston, 2015-01-01